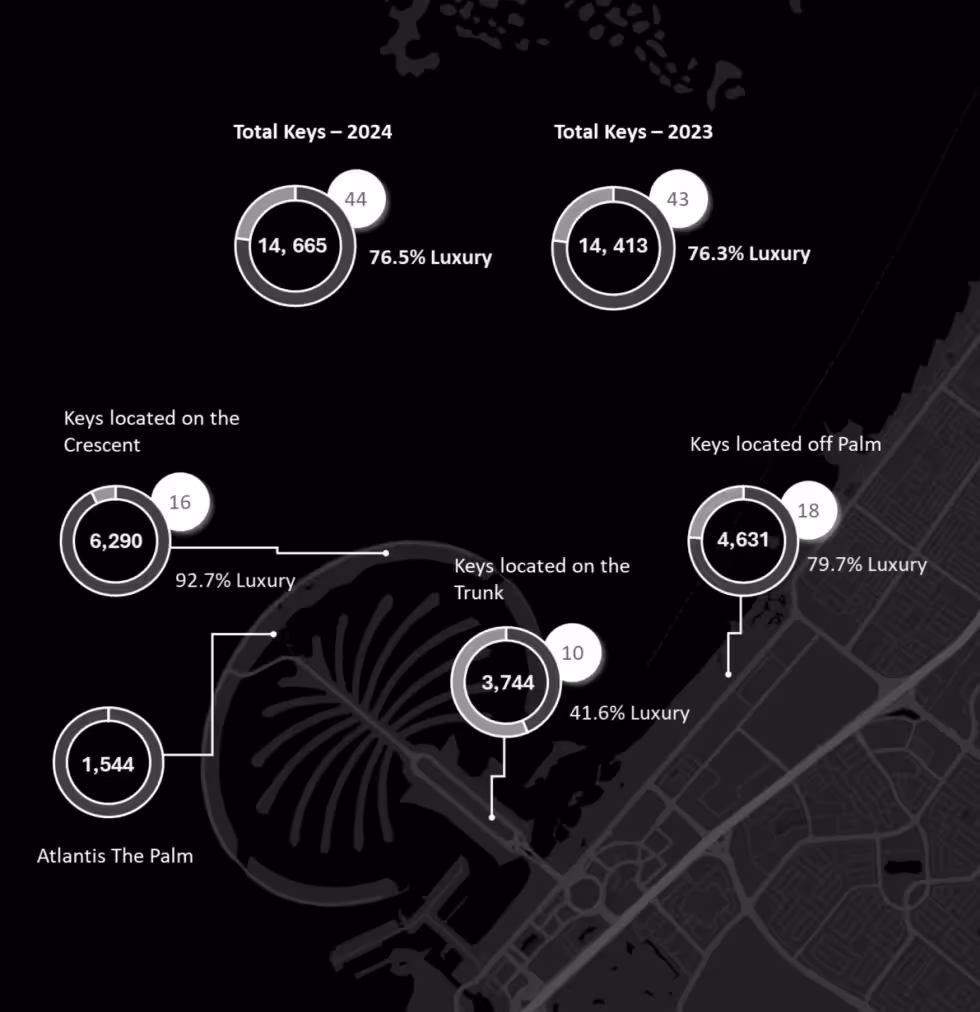
Supply
Luxury & Upper Upscale Supply Evolution

Real Estate X have detailed operating hospitality supply for all Luxury and Upper Upscale benchmarks within the Palm Jumeirah and Beaches segments.
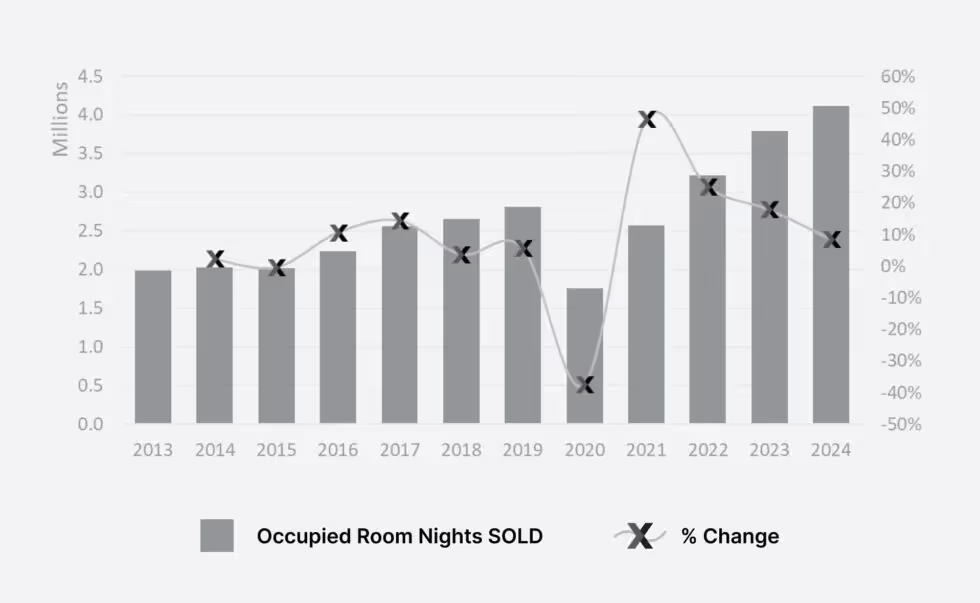
Demand
Palm & Beaches (Luxury & Upper Upscale) Occupied Room Nights
Palm & Beaches Segment Breakdown (2024) – Luxury and Upper Upscale

Performance
Palm & Beaches (Luxury & Upper Upscale) rooms revenue indexed to 2022
Performance indexed to 2022. The segment market achieved an average occupancy of 77.6% and an ADR of AED 1,948.05 during 2024, equivalent to a 3.3% increase in RevPAR over the same period in 2023.
Key Performance Indicators (running 12 months 2024)
Value per key
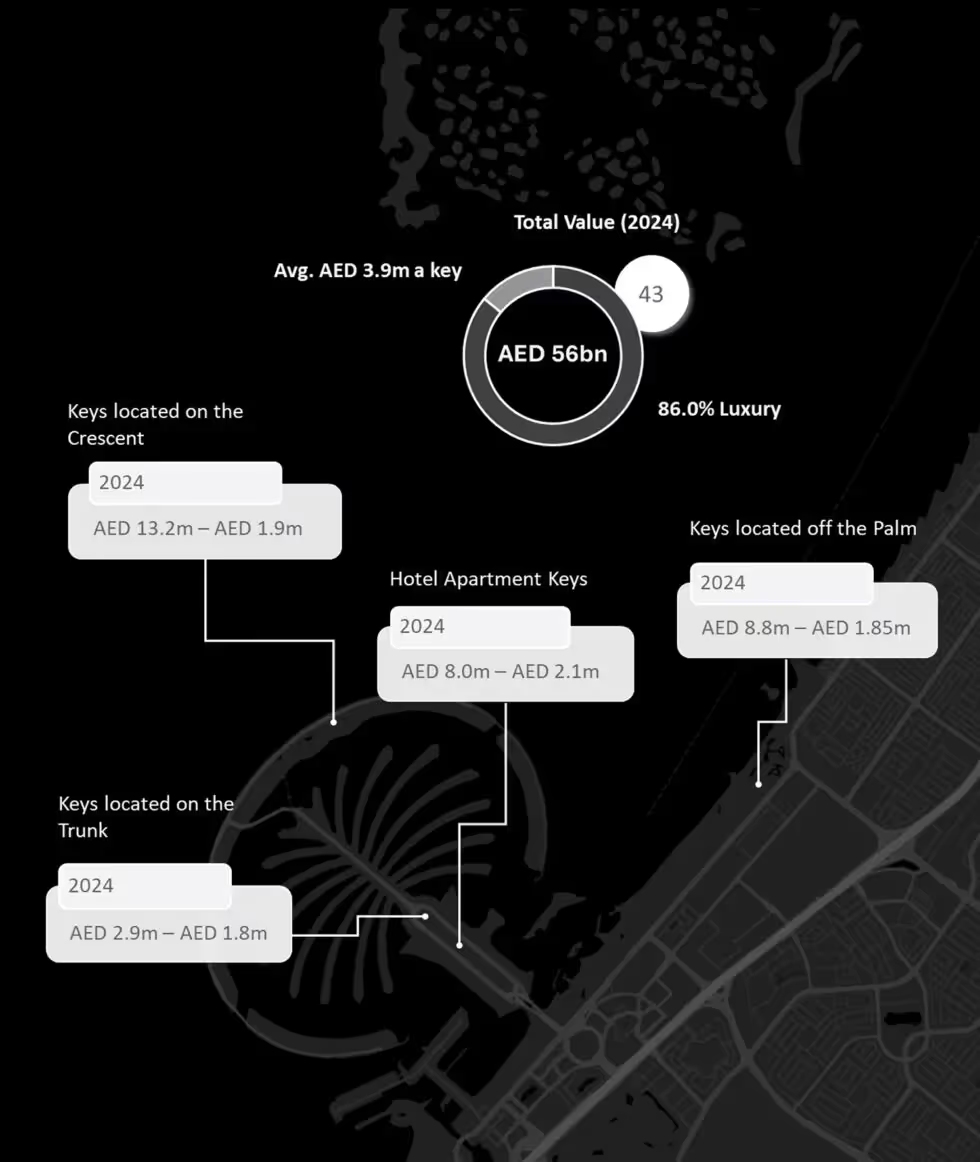
Real Estate X have endeavoured to provide an estimation of the total value of the 43 operating hotels within the Palm & Beaches (Luxury & Upper Upscale).
Recent Transactions – Per Key
Sept 2024 – AED 2.1m – Hotel Apartment Building
Dec 2023 – AED 3.2m – Hotel Building
Oct 2023 – AED 10.6m – Hotel Building
Mar 2023 – AED 10.4m – Hotel Building
Note: Burj Al Arab has been excluded. The analysis assumes that all available inventory is not subject to strata title.
Methodology
Capital value assessments are conducted across the segments using municipality statistics, STR, HOTSTATS and Real Estate X – Discovery data. This work is based on secondary market research and analysis of financial information available to Real Estate X at the time of the assessment. Real Estate X uses actual operating data to determine a reasonable level of EBITDA, less FF&E with the assessment date being 1 Sep 2024. Coupled with transactional evidence and forward-looking assumptions that reflect expectations of the market at the date of assessment, we assess any changes in perceived value.
Real Estate X gathers its data from sources it considers reliable; however, it does not guarantee the accuracy or completeness of the information provided. Any forward-looking information and statements contained herein are subject to various risks and uncertainties, many of which are difficult to predict and could cause actual performance to differ, other firms may also have differing opinions, projections or analysis. The information and analysis herein do not constitute advice of any kind and should not be used for investment purposes, Real Estate X, nor any of its subsidiaries or their respective officers, directors, shareholders, employees or agents accept any responsibility or liability with respect to the use of or reliance on any information or analysis contained in this document.
This work is copyright Real Estate X and may not be published, transmitted, broadcast, copied, reproduced or reprinted in whole or in part without the explicit written permission of Real Estate X and Real Estate X has no obligation to update or alter its opinions should market dynamics later change.
Explore Our Latest Insights
This blog explores the importance of surrounding yourself with like-minded individuals, mentors, and networks that can provide guidance, encouragement